User:Leowezy/Sandbox
What you can get out of this tutorial
After going through this tutorial, you will know
- how much energy your country consumes and from what sources
- how many power plants you need for electricity generation, what types, and what sizes
- what your country's power grid could look like
Fundamentals
All aspects of society and the built environment—and therefore maps—are shaped by how we generate and use energy to extract resources, produce goods, and transport them and ourselves. Thinking about how energy is generated, distributed, and used in your country is a key but often overlooked aspect of realistic map-making. Below, I've written some guidance on how to start thinking about these topics for your mapping project.
First, let's get some terminology out of the way:
The terms energy and electricity are sometimes used interchangeably in everyday life, but they are not the same. You use energy to heat your house, but that energy can arrive in different forms: as oil delivered by a tanker truck and burned for heat, as hot water from a nearby power plant through district heating, or as electricity running an electric heater. Electricity, however, is a particularly versatile way to distribute energy; it can be generated from many sources, transmitted almost instantly, and used for nearly all types of energy consumption.
Any physics teacher will quickly point out that no form of energy, including electricity, is truly "created" or "produced"—energy can only be transformed from one state to another, with an inevitable loss due to entropy. For the sake of readability, we won’t get too hung up on this distinction.
Energy (and therefore electricity) consumption can be measured at various points between generation and use. For this simplified tutorial, we will focus on two key stages:
- Energy Production (EP): The energy leaving a power plant as electricity or oil from a refinery.
- Final Energy Consumption (FEC): The amount of energy the consumer is billed for, such as household electricity usage.
Energy consumption is commonly recorded separately by economic sector. The way statistics are reported varies by country, but a common classification includes Transport, Industry, Households, and Services. Each sector relies on different energy sources, and each country has a distinct share of energy consumption across these sectors. These categories serve as a useful starting point for estimating energy demand in your country.
Lastly, some physics. Energy is measured in Joule (expressed as [J], or [kg*m^2/s^2]). One joule is the amount of energy needed to lift ca. 102 g by one meter in earth's gravity, or heat one gram of water by 0.24 degrees Celsius[1]. From your power-bill, you are most likely used to the unit Watt [W]. Watt describes the rate of energy usage: one Watt means one Joule per second. On your power-bill (at least in Europe), you will most likely see price and consumption measured in Watt-hours, or [Wh]=[J/s*h]. One Wh is the amount of energy used if you consume energy at the rate of one Watt, for one hour. If you look at the SI notation carefully, you can see that Watt-hour is somewhat of a misleading unit: we first divide by time to get from Joule to Watt, and then multiply with time to get to Watt-hour. For this reason, we can easily convert between Joule and Watt-hour: 1*Wh = 1*J/s*h = 1*J/s*3600s = 3600*J. Lastly, all units can be exponentiated by 1000, one million, one billion, and one trillion using the prefixes kilo- [k], mega- [M], giga- [G], and tera- [T], respectively. For instance, one Giga-Watt-hour is 1,000,000,000 Wh.
Final Energy Consumption (FEC) by sector
When considering energy production and consumption in your country, a good starting point is examining the per-capita FEC of real-world countries similar to the one you’re mapping. The table below presents data converted from International Energy Agency (IEA) reports[2]. If your country doesn’t closely resemble any of the examples provided, you may need to conduct your own research to find more relevant data.
| FEC per capita and year [MWh] | ||||
|---|---|---|---|---|
| Country | Transport | Industry | Households | Services |
| China | 2.6 | 9.3 | 3.1 | 0.8 |
| Germany | 7.4 | 7.5 | 7.6 | 3.8 |
| Nigeria | 1.1 | 0.4 | 1.3 | 0.2 |
| US | 21.2 | 9.6 | 9.4 | 7.3 |
| Nordicland | 13.0 | 5.0 | 11.0 | 4.0 |
When selecting per-capita Final Energy Consumption (FEC) by sector for your country, consider the following:
- How rich is your country? Energy consumption is almost directly (though not linearly) tied to GDP. A country where people struggle to pay for food will use only a fraction of the energy of a country where people have money left over to go on long car trips and heat swimming pools.
- How cheap is energy overall? A country with plentiful cheap energy resources (e.g., US, Russia) will likely be less incentivized to save energy across all sectors than a country that has to import most of its energy sources (e.g. Germany, France)
- How important is energy-intensive industry (e.g., steel-works or chemical industry) for your country's economy? This will determine the amount of energy industry demands.
- How much do your people travel in every-day life, and do the do so mostly by train and bus, or by car, which uses more energy?
- What is the climate of your country like? Especially for households in cold or temperate countries, heating usually is the largest consumer of energy. Between countries with such a climate, the degree to which houses are insulated also makes a large difference. Countries in very hot regions, especially if rich, will in turn use a lot of energy for air-conditioning.
For this tutorial, let's imagine a hypothetical nation called "Nordicland". It has little heavy industry, but it's very rich, cold, and car-dependent. It has a population of 10 million people. Based on the table, let's assume a yearly per capita FEC of 13, 5, 11, and 4 MWh for transport, industry, households, and services, respectively. Multiplying with the population we arrive at total yearly FECs of 130, 50, 110, and 40 TWh for each sector.
Energy sources
After determining each sector's yearly Final Energy Consumption (FEC), the next step is deciding which energy sources fulfill that demand.
Again, you will most likely have to take inspiration from real world countries that you try to emulate, and then diverge from that starting point. Note that electricity is of course not the "real" source of energy; electricity itself can be generated in oil, coal, or nuclear power plants, in wind turbines, solar cells, etc. But for the sake of this calculation, we just look at the way the energy arrives at the end consumer, and we'll worry about how that electricity is generated later.
Obtaining sector-specific data on energy sources (beyond just electricity) is challenging. Again, let's look at data from IEA. We can see that in France[3], the majority of energy used by industry comes from electricity and gas. In China[4] on the other hand, coal plays a much more dominant role. Go through some countries on the IEA's page that you feel like are similar to Nordicland and have a look at what share of their energy consumption in each sector comes from what source. Some things to consider:
- What sources are suitable for each sector? For transportation, oil and electricity are almost the only options. In industry, especially heavy industry, coal, oil and gas are often needed for intense heating processes and not easily replaced by electricity. Household heating can be done both through electricity and combustion processes. Services often are similar to households in terms of energy sources, since restaurants, offices and shops use energy in similar ways to residential buildings.
- What sources are cheap and available? If your country has gushing oil wells, it will likely try to use that oil domestically.
Looking at real-world data, you will see that there are some niche energy sources with small shares, like bio-fuels and waste. You decide how detailed you want to get; don't be afraid to use a category "others". For Nordicland, let's assume it's in the middle of transitioning from combustion engines to electric cars; the little industry it has is comparatively light and uses a lot of gas and electricity; and it's households and services use oil and gas for heating and electricity otherwise. After entering these made-up percentages in the table below and multiplying with the total FEC of each sector from the previous section, we then obtain the total FEC of each sector for each energy source. Lastly, we add up the FEC of each energy source across sectors (right-hand column "Total").
| Nordicland | Transport | Industry | Households | Services | Total |
|---|---|---|---|---|---|
| Total [TWh] | 130 | 50 | 110 | 40 | 330 |
| Electricity [%] | 30 | 40 | 30 | 40 | |
| [TWh] | 39 | 20 | 33 | 16 | 108 |
| Coal [%] | 5 | ||||
| [TWh] | 2.5 | 2.5 | |||
| Oil [%] | 70 | 5 | 30 | 25 | |
| [TWh] | 91 | 2.5 | 33 | 10 | 136.5 |
| Gas [%] | 40 | 30 | 25 | ||
| [TWh] | 20 | 33 | 10 | 63 | |
| Other [%] | 10 | 10 | 10 | ||
| [TWh] | 5 | 11 | 4 | 20 |
You now know your total electricity consumption: 108 TWh per year. Having time cancel with itself, that is a power output of 108[TWh/year/(8766h/year)] = 12.3[GW].
Electricity Sources
For this section, we assume that Nordicland does not import or export electricity. If your country is a net importer or exporter, you can adjust the necessary domestic electricity production downwards or upwards, respectively.
Electricity mix
We want to calculate how much power plant capacity we need for each electricity source, so we need to think about what share of electricity is generated by which source. Some nations, like Iceland or Norway, are blessed with natural renewable power sources and have a low population density, allowing them to generate most of their power with geothermal and hydro-electric power plants, respectively. Countries with oil or coal reserves will try to capitalize on these resources. Most other countries rely on a mix of various sources of electricity.
Globally, coal is still the largest source for electricity[5]. From the same source, we can also have a look at country specific electricity (not energy!) mixes. For Nordicland, let's assume it has lots of potential for hydro-electric and wind power, imports some fossil fuels and has a little nuclear power.
| Share of electricity production [%] | |||||||||
|---|---|---|---|---|---|---|---|---|---|
| Country | Solar | Hydro | Biomass | Wind | Gas | Oil | Coal | Nuclear | Other |
| China | 5 | 15 | 2 | 9 | 3 | 0 | 62 | 5 | 0 |
| Germany | 12 | 5 | 8 | 27 | 17 | 1 | 27 | 1 | 2 |
| Nigeria | 0 | 24 | 0 | 0 | 76 | 0 | 0 | 0 | 0 |
| US | 5 | 6 | 1 | 10 | 42 | 1 | 17 | 18 | 0 |
| Nordicland | 1 | 25 | 2 | 30 | 20 | 1 | 10 | 10 | 1 |
Load factor and grid loss
After deciding on our energy mix, we need to clarify a few terms again. The peak power of a power plant is the maximum amount of energy it can put into the power grid per second. The average power is the amount of power that it actually outputs on average per second, over a whole year.
For some sources, these values are very close together. Nuclear power plants for example are very expensive to build and take a long time to spin up, so they are usually ran at full capacity and only shut down for maintenance. Solar on the other hand only produces its maximum power output on a sunny day during noon, and much less or nothing during other times. For other sources, the ratio will depend on how the respective power source is used in that country; for example, hydro-electric and gas power plants can either be ran flat-out, or used to fill the gap when wind and solar are tanking, depending on the policy of your country. For wind and solar, load factor also depends on the climate. The ratio of average to peak power is called load factor.
Let's try to estimate load factors for Nordicland. We can start by looking at data from Germany[6]. Additionally, let's say that hydro-electric and gas power are used a demand-responsive source, and that Nordicland has little sunshine, resulting in low respective load factors. Most of the wind is offshore, where wind blows more constant than on land.
Also, we now account for the difference between EP and FEC mentioned in the beginning: you need a little more power plant output than what your consumers use, because a sizable part is lost on the power grid. This depends on how technologically advanced your country is and how far power has to travel between source and consumer. As a rule of thumb, this grid loss should be between 5 and 10%. Since Nordicland is thinly populated and some of the electricity has to travel far to the urban centers, let's assume a value of 8%.
Based on the load factor and grid loss, we can now calculate the ratio of necessary peak power output to average power consumption. This ratio is calculated as R = (1 + grid loss) / load factor. As you can see, based on our assumption we need almost 11 times as much solar power as indicated by the solar cell's peak output to generate a given average consumption. For nuclear on the other and, we only need a little more peak power output than what we actually consume on average.
For the column av. power consumption [GW], we simply multiply each electricity source's share in Nordicland with our total electricity consumption of 12.3 GW. For solar, this is 0.01 * 12.3[GW] = 0.12[GW]. Then we multiply R with the av. power consumption to reach the necessary peak power output.
| Electricity source | Load factor [%] | Grid loss [%] | R [%] | Av. power consumption [GW] | Nec. peak power output [GW] |
|---|---|---|---|---|---|
| Solar | 10 | 8 | 1080,0 | 0.21 | 2.27 |
| Hydro | 20 | 8 | 540,0 | 5.14 | 27.76 |
| Biomass | 50 | 8 | 216.0 | 0.41 | 0.89 |
| Wind | 23 | 8 | 469.6 | 6.16 | 28.93 |
| Gas | 30 | 8 | 360.0 | 4.11 | 14.80 |
| Oil | 20 | 8 | 540.0 | 0.21 | 1.13 |
| Coal | 50 | 8 | 216.0 | 2.05 | 4.42 |
| Nuclear | 90 | 8 | 120.0 | 2.05 | 2.46 |
| Other | 50 | 8 | 216.0 | 0.21 | 0.45 |
Before moving on, perform a plausibility check: If all non-controllable energy sources (especially wind and solar) were to shut down completely, could your country still meet its average electricity demand by maximizing the output of controllable sources (such as fossil fuel plants, hydro, and imports)?
For Nordicland, this is straightforward: Hydroelectric power has an average load factor of 20% but provides 25% of the country’s electricity consumption under normal conditions. If all other energy sources were to shut down, running all hydroelectric dams at full capacity could temporarily meet the country’s electricity demand.
Power Plants
In this section, we use the necessary peak power output from the previous step to estimate the number and size of power plants required for each electricity source. The figures here are meant to provide a rough sense of scale and a framework for approaching this topic. Once you determine the number and peak power output of your country’s power plants, you can more easily find real-world examples to guide your mapping.
Solar
Photovoltaic cells convert sunlight into electricity via the photovoltaic effect, where photons excite electrons in a semiconductor material, typically silicon. This electron movement generates an electric current within the cell. Multiple photovoltaic cells are combined into solar panels to generate usable power for various applications. We won’t be considering solar thermal energy for this tutorial—let’s assume the electricity output of solar thermal and photovoltaic systems is identical, and group them both under the category of solar.
The climate of a region is already partly reflected in the load factor—areas with consistent sunshine tend to have higher load factors than those that are mostly cloudy. For this calculation, we'll assume climate and location do not further affect solar efficiency. When in doubt, increase the final number of solar panels by 10-50% if your country (like Nordicland) is not very solar-friendly. Additionally,
For peak power output, we can assume 200 W/m^2[7]. To calculate the total area of solar panels, divide your peak power output by 200 W/m². For Nordicland, this gives 2,270,000,000 W / 200 W/m^2 = 11,350,000 m^2 = 11.35 km^2. This area can be distributed across rooftops or solar farms.
Mapping examples: when located on building roofs, solar panels are usually not mapped. On OSM, larger-scale solar power plants are often tagged using landuse=industrial, power=plant, and power:source=solar. Examples can be found Error creating thumbnail: here (Spain) or Error creating thumbnail: here (US).
Hydro
Note that while other energy sources are explained relative to peak power output, hydro-electric power is explained in terms of average power production. This is because precipitation and dam height limit average power output, whereas peak power output can be increased by adding more turbines and adjusting the load factor. Therefore, ignore any previous calculations related to load factor and work directly with average power consumption * (1 + grid loss). For example, for Nordicland, we would calculate 5.14 [GW] * 1.08 = 5.55 [GW]
Hydro-electric power plants are restricted by geography. It's important to note that, as you set ambitious goals for hydro-electric power, you may find that your country does not have sufficient hydro-electric potential to meet those targets. If that happens, after reaching your hydro-electric capacity, revisit your calculations and reduce the share of hydro-electric power in your overall electricity mix.
Let's start with some physics.
Hydro-electric power plants generate electricity by converting the potential energy of stored water into electrical energy. Gravity causes the water to flow downward, and its volume and height determine the total energy available. This flowing water drives turbines, converting the water's kinetic energy into mechanical energy. Finally, a generator connected to the turbine transforms this mechanical energy into electricity, which is then transmitted for use.
Assuming 100% efficiency, the output of a hydro-electric power plant can be calculated as:
P[W=kg*m^2/s^3] = height[m] * 9.81[m/s^2] * mass[kg] / time[s].
Height is the height difference between turbine and water surface. Note that the more water a dam releases, the less power it generates from every additional bit of water it releases, because the level of the reservoir and hence the potential energy of the remaining water get lower. In practice, this is a trade-off:
- For flood-prevention, dams should be kept at low water levels so that in the case of heavy rain or floods, the reservoir has empty space to store the incoming water instead of releasing it downstream.
- For maximum total power generation, the level in the reservoir should be kept as high as possible.
- When used for load balancing, the water level should be kept somewhere in the middle, so that when e.g. wind and solar are running strong, the dam can be shut down and still have room to collect water, which it then releases when wind and solar are less productive.
- Seasonal factors also play a role: to level out differences in rainfall throughout the year, dams might want to save up water during rainy seasons and release it during dry times.
For your power calculation, as a rule of thumb, use half the structural height of the dam for your calculation. You can adjust this assumption based on what role the dam plays in your power grid relating to the points above. For a list of highest dams, see here[8]. The vast majority of dams will be much, much smaller - for every dam 100 m in height, there will be dozens if not hundreds of smaller dams only a few meters in height.
9.81 is the gravitational force on earth.
Mass per time is the amount of water, in kg, that is released per second. If you don't have good estimated for your stream or river flow, you can estimate it based on its catchment area and the average precipitation there. If your dam's water inlet collects water from a catchment area of 1,500 km^2 and the average precipitation per year is 700 mm (in tall mountains, this value can be much higher or lower, depending on the climate and the direction of the wind), that means it rains a total of 0.7 m * 1,500,000,000 m^2 / year = 1,050,000,000,000 kg/year. On average, that is 33,291 kg/s. Watch our for the number of 0s; one km^2 is not one thousand but one million m^2, and one m^3 of water weighs one thousand kg. If the catchment area is very warm or water is used for irrigation, reduce this amount of water accordingly.
Lastly, be aware of a negative correlation between height and mass per time. Regard the two pictures of very different dams on the right: Most dams that are very tall are located in narrow mountain valleys, where the catchment area is small and hence the amount of water flowing per second is low. However, the steep topography allows for a large amount of energy to be generated for every kg of water. The amount of water flow rises as we follow the stream and river downstream, however the topography will flatten out, too, meaning a dam there won't be able to reach hundreds or even just dozens of meters in height without needing to be too wide and flooding huge swaths of land. On large rivers, we therefore often see run-of-the-river hydroelectricity, where the water drops only a meter or two and no visible reservoir exists, but the large amount of water per second means a considerable amount of electricity is generated nonetheless. Note that ships need locks to traverse these power plants, which is why they are usually not found on rivers used for shipping. There are rare exceptions where dams are both tall and dam up a major river, but those are considered engineering marvels and flood huge swathes of land upstream[9].
Mapping examples: the reservoir of a dam is tagged as natural=water, with the optional specification water=reservoir. The dam itself should be tagged as waterway=dam. Additional, external service buildings both at the top and bottom of the dam are usually quite small compared to the dam itself. Examples can be found Error creating thumbnail: here (Switzerland), Error creating thumbnail: here (Thailand) or Error creating thumbnail: here (Japan).
Biomass
In many cases, biomass power plants are relatively small and are often co-located with agricultural businesses. As a result, this tutorial does not include specific guidance on such plants at this time.
Wind
Wind turbines harness the kinetic energy of moving air by rotating a turbine which in turn generates electricity.
For wind energy, it's important to differentiate between onshore and offshore wind turbines. Offshore wind turbines tend to run more consistently, which means a country's overall load factor for wind energy will depend on the proportion of onshore versus offshore turbines. Additionally, regions with stronger, more constant winds will have a higher load factor compared to areas with frequent wind slumps. If you haven't already, revisit the load factor and look for real-world values from regions similar to yours.
Once you have a load factor, planning the number of wind turbines needed based on peak power output is fairly straightforward. The key factor to keep in mind is that the peak output per turbine can vary significantly depending on its size, with turbines having become much larger in recent decades. To ensure accuracy, divide the turbines into categories based on their size and whether they are onshore or offshore. Then, assign numbers of turbines for each category until you reach the total peak power output required. For Nordicland, this total is 28.93 GW. Typically, there will be many smaller turbines for every large one, so expect smaller categories to have more turbines than the larger ones. Distribute the number of turbines across the categories in a way that realistically matches the required total power output.
| Type[10] | Height/diameter [m] | Peak power [MW] | Number Nordicland | Power Nordicland [MW] |
|---|---|---|---|---|
| Small (onshore) | 50/30 | 0.5 | 6000 | 3000 |
| Medium (onshore) | 80/50 | 3.0 | 2400 | 7200 |
| Medium (offshore) | 160/80 | 7.0 | 1390 | 9730 |
| Large (offshore) | 220/110 | 15.0 | 600 | 9000 |
| Sum | 28930 |
Mapping examples: individual wind turbines are usually mapped as nodes with the tags power=generator, generator:source=wind, and generator:method=wind_turbine. Large wind parks can be additionally marked using areas with the tags power=plant and plant:source=wind. Examples can be found Error creating thumbnail: here (Germany), Error creating thumbnail: here (Namibia), or Error creating thumbnail: here (New Zealand).
Coal, Gas, Oil, and Nuclear
In coal (including lignite), gas, and oil power plants, the respective fuel is burned and the resulting heat is used to heat up water and create steam. This steam is funneled through a turbine and then cooled down in a cooling tower. The pressure gradient pushes the steam through the turbine, turning it and generating electricity. In a nuclear power plant, nuclear fission of uranium atoms serves as the heat source, but the rest of the process remains the same. For this reason, these power plants are also collectively referred to as thermal power plants. The steam coming out of cooling towers is just water vapor. Some power plants on the coast or at major rivers also use these external water sources for cooling. The fossil power plants expel the see-through CO2 as well as particulate matter through smaller chimneys.
For these four types of thermal power plants, we use a similar approach to the one used for wind turbines: we classify power plants into rough categories based on peak power and then calculate how many we need of each size category. The coal[11], gas[12], oil, and nuclear[13] power plant sizes are based on Wikipedia lists of various countries; depending on the size, wealth, and history of your country, the average power plant size may be smaller or bigger than the classes provided here. Again, look at real world examples to get an idea of what size range would be realistic for your country. Large oil power plants are often combined with gas power plants, since natural gas deposits are often found near oil deposits and in oil refinery, burnable gases are released.
Large power plants usually consist of several, often standardized reactors or units. Like for wind turbines, the number coal, gas, and oil power plants should decrease with increasing peak power per power plant. For nuclear reactors, small nuclear power stations are usually research facilities and negligible in terms of electricity generation and the significant power plants consist of at least one up to a hand full of reactors with ca. 1 GW peak power each. After adjusting the power plant sizes to your country's setup, again try to fill in the numbers in such a way that for each electricity source you generate enough peak power to meet the necessary peak power output from section "load factor and grid loss", in Nordicland's case: 4.42, 14.80, 1.13, and 2.46 [GW] for coal, gas, oil, and nuclear, respectively. Don't worry about hitting the exact number, especially if you end up with only one or two power plants for a given source. As you can see, because Nordicland is a rather small country, only few large power plants are needed.
| Type | Peak power [GW] | Number Nordicland | Power Nordicland [GW] |
|---|---|---|---|
| Coal | |||
| Small | 0.3 | 5 | 1.5 |
| Medium | 1.0 | 3 | 3.0 |
| Large | 3.0 | 0 | 0.0 |
| Sum | 4.5 | ||
| Gas | |||
| Small | 0.2 | 20 | 4.0 |
| Medium | 0.6 | 8 | 4.8 |
| Large | 2.0 | 3 | 6.0 |
| Sum | 14.8 | ||
| Oil | |||
| Small | 0.1 | 3 | 0.3 |
| Medium | 0.5 | 2 | 1.0 |
| Large | 1.0 | 0 | 1.3 |
| Sum | |||
| Nuclear | |||
| Small | 0.2 | 1 | 0.2 |
| Medium | 1.0 | 0 | |
| Large | 3.0 | 1 | 3.0 |
| Sum | 3.2 | ||
You can now make a more detailed list of power plants for each source with precise peak power values for each power plant and either map them all at once or as you go along. Remember that this section includes only power plants used to supply electricity to the power grid. In addition to this, oil, gas, and coal will likely be used in large quantities for industrial processes, and some types of power plants such as long-distance heating plants or power plants attached to oil refineries also burn fossil fuels but are not part of this list.
Mapping examples: The following table presents some examples for each type and size of power plants.
| Coal | Gas | Oil | Nuclear | |
|---|---|---|---|---|
| Small | Error creating thumbnail: Collie (Australia) | Error creating thumbnail: Münster (Germany) | usually combined with gas | Error creating thumbnail: Research reactor (Belgium) |
| Medium | Error creating thumbnail: Montour (US) | Error creating thumbnail: Tambak Lorok (Indonesia) | usually combined with gas | Error creating thumbnail: Saint-Laurent (France) |
| Large | Error creating thumbnail: Niederaußem (Germany) | Error creating thumbnail: Surgut (Russia) | Error creating thumbnail: Hirono (Japan) | Error creating thumbnail: Kori NPP (South Korea) |
Final Remarks on Electricity Production
When working through this section, don't hesitate to iterate your planning process; you might start out with a specific electricity mix and then realize that you don't have enough electricity sources that can be turned on when less reliable sources don't deliver, or you might realize during power plant planning that you don't have enough locations for dams to satisfy your desire for hydro-electric power. Also, don't be disappointed if you find it difficult or even impossible to reach carbon-neutrality; there is a reason the world is struggling to de-carbonize as quickly as climate scientists are urging us to, and going through this planning process is a valuable learning experience to understand where these choke points are.
Electrical grid
Electricity has to be transmitted between power plants, storage facilities, and consumers. Again, let us first build some basic understanding of parameters that are relevant to electricity transmission:
Electricity can be transmitted as Direct Current (DC) or Alternating Current (AC). In DC systems, electrons flow in a single direction. You can imagine a power line like a water pipe, with electrons moving through it like water, pushed along by the power plant. The "pressure" the power plant exerts on each electron - essentially the amount of work done per charge - is called voltage. Electrons aren't "used up" at the consumer’s end; instead, think of them powering a small water wheel that harnesses the pressure they carry. Because of this, you don’t just need one pipe leading from the power plant to the consumer, but you also need a return pipe, so electrons can flow back after delivering their energy, preventing a buildup. DC is commonly used in batteries and some specialized long-distance transmission lines. With AC, the water analogy still applies, but the direction of electron flow reverses rapidly - typically 50–60 times per second. This alternating nature makes it easier to change voltage levels using transformers, which is why AC is standard in most national power grids.
We can increase the amount of power transmitted through a power line either by increasing the current (the number of electrons flowing) or by increasing the voltage (the energy per electron). High voltage allows large amounts of power to be transmitted with a lower current, which helps reduce power loss due to resistance—because these losses grow with the square of the current but are unaffected by voltage. That’s why high-voltage power lines are used for long-distance transmission. Since high voltages are dangerous to handle directly, transformer stations are used to step voltage down from the high-voltage transmission grid to the medium- or low-voltage local distribution networks.
Low-voltage power lines and underground power lines are usually not mapped explicitly. In the following, let us therefore focus on high-voltage power lines and national grids only. Similar to motorways, you might ask yourself "how much high-voltage power line mileage would my country need realistically?" There is no easy answer to this, as a detailed simulation of all your fictional country's power consumption, production and transmission will not be feasible for the vast majority of mappers. You can however get a feeling for a plausible density of the grid by looking at similar countries in the real world. Consider the following overpass queries: Belgium, New Zealand, Ghana, and Argentina.
Notice how:
- Power lines are particularly dense around areas of electricity production (powerplans) and consumption (in particular energy-intensive heavy and chemical industry)
- They correlate with population density, but less so than motorways; this is because in high-demand areas, higher capacity lines will be used. Sparsely populated areas will be connected using cheaper, low-capacity lines, but they are connected nontheless.
- There's a high degree of redundancy in the network.
- In cities, the network appears to have gaps; here, power lines are usually built underground, or transformer stations are situated in the city periphery. Power lines often converge here instead of heading straight towards the center of a metropolitan area.
For how power lines are mapped in detail, have a look at examples from Error creating thumbnail: France, Error creating thumbnail: China, Error creating thumbnail: Namibia and the Error creating thumbnail: US.
Notice how:
- Power lines are tagged with "power=lines", power towers with "power=tower".
- Power lines run straight between towers.
- The maximum distance between power towers ranges from 100 to 500 m. The taller the towers, the longer the distance.
- Power lines usually split at transformer stations.
- On high-demand routes, several power lines run in parallel. The horizontal distance depends on the size of the tower and the number of cables, but will usually range between 30 and 100 m. Sometimes the towers of two parallel power lines will align, especially if they were built at the same time.
- The land underneath power lines is usually undeveloped. Forest are usually cleared underneath power lines (which can be tagged using natural=scrub). Where power lines were first and development occured later, the development avoids the (mostly straight) power lines. Where power lines where retrofitted into an already developed area, tower placement is restricted and the line is less straight.
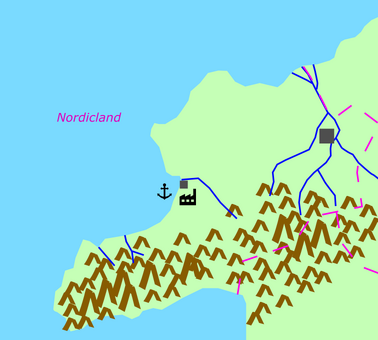
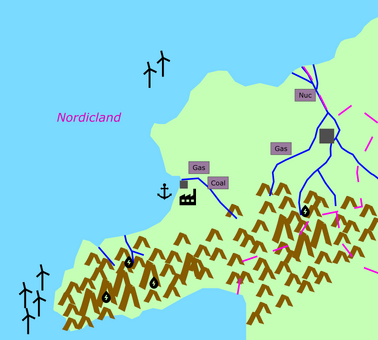
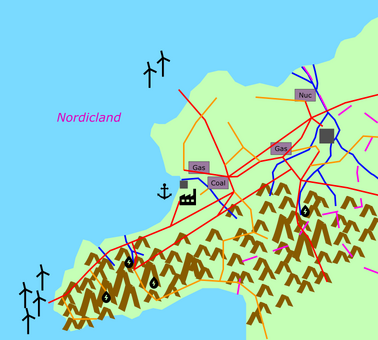
Let's use our freshly built understanding to make a rough plan for Nordicland's power grid. We start with the general natural and human geography of the country (1): its west is marked by sparsely populated, rough mountains, receiving heavy sea winds and lots of rainfall. Its industry is concentrated in the center, where a large port facilitates trade. The country's capital and largest city sits in the east. In the second step (2), think about where which kind of power will be generated the most. Focus on large-scale power production only. Wind power will be most efficient offshore, mostly on the western end, but some additional offshore parks might be located in the north. Hydroelectricity, a major electricity source for Nordicland, will be found in the mountains, mostly in the almost uninhabited mountains in the west. Since Nordicland has to import coal, its few coal power plants will mostly be near the large harbour, where coal can be imported and the air is heavily polluted anyway. Cas and nuclear power will be centered in the east, since wind and dams already produce more than enough electricity in the west. Note that the nuclear plant needs to be situated close to a source for cooling water and not too close to major settlements. Of course, this is just one example for a realistic setup; you might arrive at a completely different layout of power sources. Try to think strategically about the economic, geographic and political factors that would be relevant in your country. Lastly, we can think about major power lines (3). In Nordicland, we can expect a strong focus on the east-west-axis, since power is mostly produced in the west and center, and mostly consumed in the center and east. Hydroelectricity in the west might be able to smoothen the power spikes from the wind power plants a little. Major cross-country corridors in red carry several parallel power lines with separate rows of power towers each, while the orange lines indicate less important corridors. Of course, local distribution networks will be even finer. Note how power lines meet at large transformer stations around the two major cities, to avoid building power lines over densely populated urban areas. Also, do not forget about connections to your neighbouring countries! Depending on the interoperability of your power grids, trade relations, and each country's power mix, there might be less or more need for cross-country electricity transmission.
Congratulations! You now have a comprehensive plan for energy and electricity production in your country and are ready to go and start actual mapping.
- Developing a power grid for Nordicland
-
 (1)
(1) -
 (2)
(2) -
 (3)
(3)


_(36826701770).png)
.png)
.jpg)
The future
To fade out, let's look at two energy-related topics that are not very visible on real world maps yet but may bring rapid change in the future.
Hydrogen could play a major role in de-carbonizing the economy. In this context, hydrogen is not intended as a primary source, but as a transfer medium for energy: Through electrolysis[14], water molecules (H2O) can be separated into hydrogen (H) and oxygen atoms (O). If electricity from renewable sources is used, this hydrogen is also called "green hydrogen". This hydrogen can then be burned off in a different location to release energy. This could for example be in a hydrogen fuel cell in a car, where it generates electricity, or in a steel plant. Especially for the latter, where electricity cannot be used so far to reach temperatures to melt steel, it is a unique opportunity to use renewable energy to enable these industrial processes. Unlike when burning carbon-based fuels (which creates CO2), burning hydrogen only emits water again. Besides allowing energy from renewable sources to be used in heavy industrial processes, hydrogen can be used to store large amounts of energy, serving as a buffer for when wind or solar energy output is low. Downsides of such a hydrogen economy include the safe storage and transport of large amounts of hydrogen and the energy loss in the two conversions.
Although nuclear fusion has been a topic of intense research since over a hundred years[15]. Just in front of our eyes, the sun manages to produce gigantic amounts of energy using this very physical process, but while scientists have manages to recreate it on earth in prototype reactors and in hydrogen bombs, it is still far from commercial viability. Within the sun's core and under enormous pressure and heat, hydrogen atoms are forced together and fuse into helium, which releases energy. Due to the abundance of hydrogen in the form of water, it would provide us with a clean and almost ever-lasting source of energy. It is unclear whether we will ever see nuclear fusion power plants, but if we manage to, it's bound to revolutionize electricity production.
References
- ↑ https://de.wikipedia.org/wiki/Joule
- ↑ https://www.iea.org/countries/germany/efficiency-demand
- ↑ https://www.iea.org/data-and-statistics/data-tools/energy-statistics-data-browser?country=FRA&fuel=Energy%20consumption&indicator=IndustryBySource
- ↑ https://www.iea.org/data-and-statistics/data-tools/energy-statistics-data-browser?country=CHN&fuel=Energy%20consumption&indicator=IndustryBySource
- ↑ https://www.iea.org/world/electricity
- ↑ https://de.statista.com/statistik/daten/studie/37610/umfrage/jahresvolllaststunden-deutscher-kraftwerke-im-jahr-2009/
- ↑ https://www.gasag.de/magazin/energiemarkt/photovoltaik-leistung-ermitteln/
- ↑ https://en.wikipedia.org/wiki/List_of_tallest_dams
- ↑ https://en.wikipedia.org/wiki/Three_Gorges_Dam
- ↑ https://www.inspirecleanenergy.com/blog/clean-energy-101/how-much-energy-does-wind-turbine-produce
- ↑ https://en.wikipedia.org/wiki/List_of_power_stations_in_Poland
- ↑ https://de.wikipedia.org/wiki/Liste_geplanter_und_im_Bau_befindlicher_Gaskraftwerke_in_Deutschland
- ↑ https://en.wikipedia.org/wiki/Nuclear_power_reactors_in_Europe
- ↑ https://en.wikipedia.org/wiki/Electrolysis
- ↑ https://en.wikipedia.org/wiki/History_of_nuclear_fusion